name: inverse class: title Prometheus 101 ## anarcher@gmail.com ## 2019-09-25 --- class: pic .interstitial[] --- # Selling Points - Dimensional data model - __Powerful query languages__ - Simplicity + efficiency - Service discovery integration --- # Data Model What is a time series? ```dia <identifier> -> [ (t0,v0), (t1,v1),... ] ^ ^ ^ | | | What is this? int64 float64 ``` --- # Data Model Graphite/ StatsD: ```graphite nginx.ip-1-2-3-4-80.home.200.http_requests_total nginx.ip-1-2-3-5-80.settings.500.http_requests_total nginx.ip-1-2-3-5-80.settings.400.http_requests_total nginx.ip-1-2-3-5-80.home.200.http_requests_total ``` Prometheus: ```prometheus http_requests_total{job="nginx",instance="1.2.3.4:80",path="/home",status="200"} http_requests_total{job="nginx",instance="1.2.3.5:80",path="/settings",status="500"} http_requests_total{job="nginx",instance="1.2.3.5:80",path="/settings",status="400"} http_requests_total{job="nginx",instance="1.2.3.4:80",path="/home",status="200"} ``` --- class: pic # Data Model 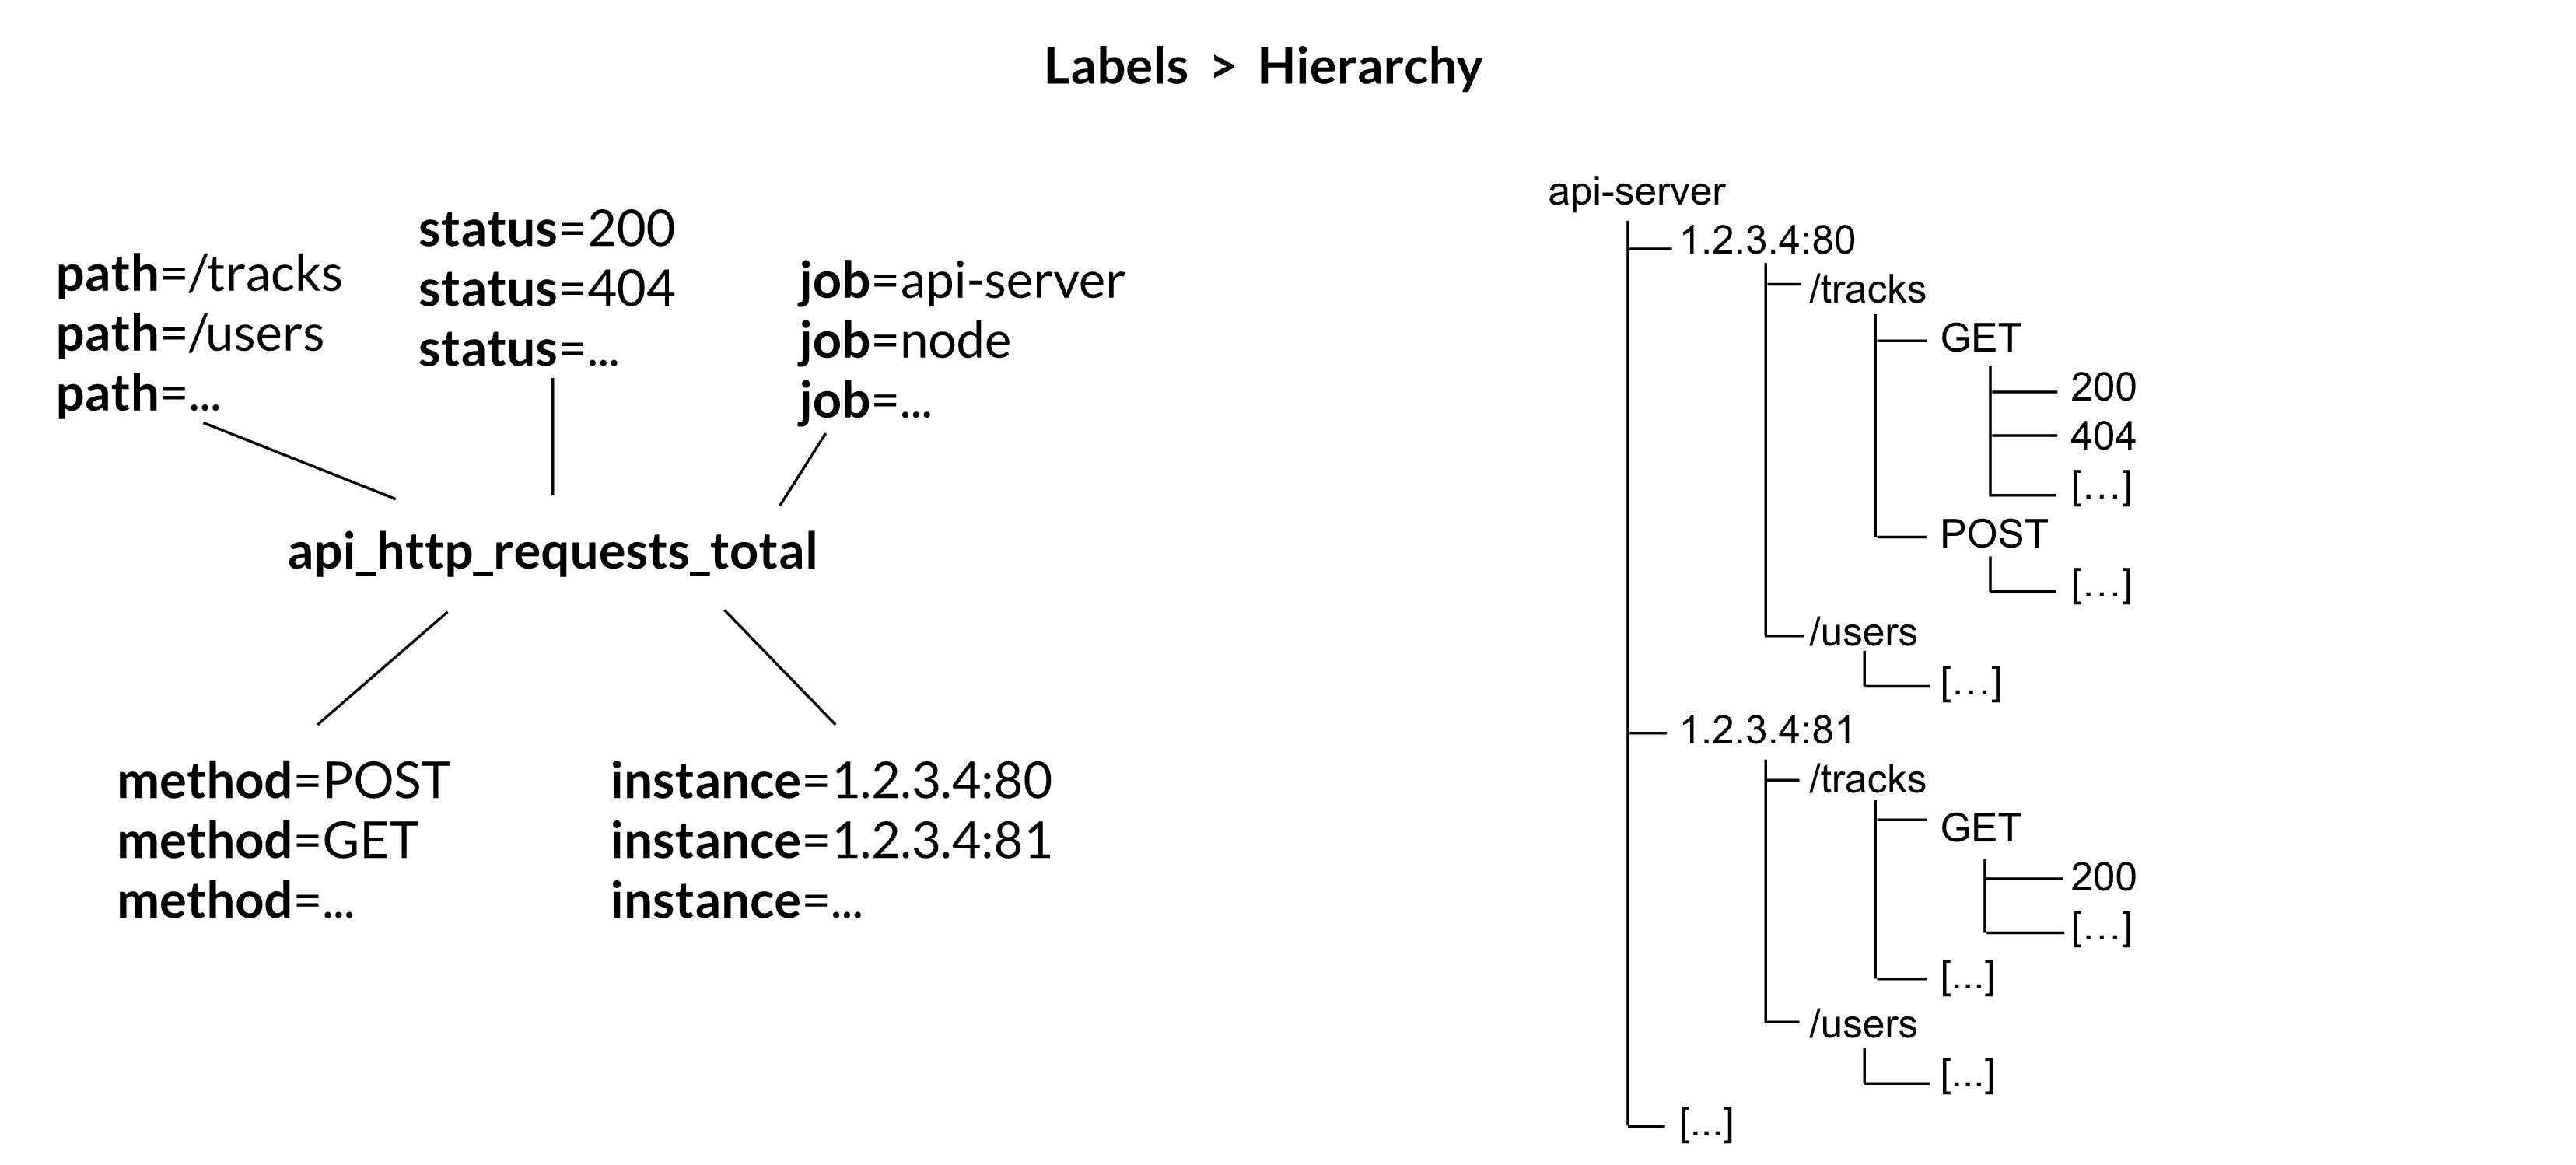 --- # Selecting Series ```graphite nginx.*.*.*.500.*.http_requests_total ``` - Implies hierarchy that doesn't exist - User-level encoding of semantics - Hard to extend ```prometheus http_requests_total{job="nginx",status="500"} ``` - more flexible - more effcient --- # Prometheus vs InfuxDB https://timber.io/blog/prometheus-the-good-the-bad-and-the-ugly/ InfluxDB and Prometheus ended up being the major competitors. They both offered stand-alone binaries, did not require the management of external data systems, and allowed for rich metadata on metrics. The two key differences between the offerings were: - Prometheus will pull data from services, while InfluxDB needs data to be pushed to the InfluxDB instance - __InfluxDB collects every data point while Prometheus only collects summaries of data points__ Both of these points have their benefits and trade-offs. By collecting every data point, InfluxDB can support complex, high-resolution queries at the cost of higher network traffic and larger on-disk storage. And pushing data to InfluxDB means that the origin system can be located anywhere; whereas Prometheus ingests data by scraping __metric summaries__ (in plain text format) from HTTP endpoints on every server. --- # Prometheus vs Graphite [Graphite Archives: Retention and Precision](https://graphite.readthedocs.io/en/latest/whisper.html#archives-retention-and-precision) Whisper databases contain one or more archives, each with __a specific data resolution__ and retention (defined in number of points or max timestamp age). <pre><code class="hljs remark-code" style="font-size: 70%;"># storage-schemas.conf [carbon] pattern = ^carbon\. retentions = 1m:14d,15m:30d [instances] pattern = ^ganglia\..+\.(huge-instances).+\..+ retentions = 1m:7d [es] pattern = ^elasticsearch_metrics\. retentions = 1m:7d,30m:30d [everything] match-all = true retentions = 1m:14d,15m:180d </code></pre> - Prometheus currently has no downsampling support (Thanos does). --- # Choosing an Appropriate Resolution for Measurements [SREBook](https://landing.google.com/sre/sre-book/chapters/monitoring-distributed-systems/) > "Take care in how you structure the granularity of your measurements. Collecting per-second measurements of CPU load might yield interesting data, but such __frequent measurements may be very expensive__ to collect, store, and analyze. If your monitoring goal calls for high resolution but doesn’t require extremely low latency, you can __reduce these costs__ by performing __internal sampling__ on the server, then __configuring an external system to collect__ and aggregate that distribution over time or across servers. You might:" - Record the current CPU utilization each second. - Using buckets of 5% granularity, increment the appropriate CPU utilization bucket each second. - Aggregate those values every minute. This strategy allows you to observe brief CPU hotspots without incurring very high cost due to collection and retention. --- # Query ```sql rate(api_http_requests_total[5m]) SELECT job,instance,method,status,path,rate(value,5m) FROM api_requests_total ``` ```sql avg by(city) (temperature_celsius{country="korea"}) SELECT city,AVG(value) FROM temperature_celsius WHERE country="korea" GROUP BY city ``` ```sql errors{job="foo"} / total{job="foo"} SELECT errors.job,errors.instance, [..more labels ],errors.value / total.value FROM errors,total WHERE errors.job ="foo" and total.job="foo" JOIN [..some more ...] ``` - https://www.robustperception.io/translating-between-monitoring-languages --- # Query All partitions in my entire infrastructure with more than 100GB capacity that are not mounted on root? ```ql node_filesystem_bytes_total{mountpoint!=”/”} / 1e9 > 100 ``` ```sh {device="sda1", mountpoint="/home”, instance=”10.0.0.1”} 118.8 {device="sda1", mountpoint="/home”, instance=”10.0.0.2”} 118.8 {device="sdb1", mountpoint="/data”, instance=”10.0.0.2”} 451.2 {device="xdvc", mountpoint="/mnt”, instance=”10.0.0.3”} 320.0 ``` --- # Query What’s the ratio of request errors across all service instances? ```ql sum(rate(http_requests_total{status="500"}[5m])) / sum(rate(http_requests_total[5m])) ``` ```ql {} 0.029 ``` --- # Query What’s the ratio of request errors across all service instances? ```ql sum by(path) (rate(http_requests_total{status="500"}[5m])) / sum by(path) (rate(http_requests_total[5m])) ``` ```ql {path="/status"} 0.0039 {path="/"} 0.0011 {path="/api/v1/"} 0.087 {path="/api/v2/assets/"} 0.0342 ``` --- # Query 99th percentile request latency across all instances? ```json histogram_quantile(0.99, sum without(instance) (rate(request_latency_seconds_bucket[5m])) ) ``` ```json {path="/status", method="GET"} 0.012 {path="/", method="GET"} 0.43 {path="/api/v1/topics/:topic", method="POST"} 1.31 {path="/api/v1/topics, method="GET"} 0 ``` --- # Query Kubernetes Container Memory Usage ```ql sum by(pod_name) (container_memory_usage_bytes{namespace="kube-system"}) ``` ```ql {pod_name="kube-state-metrics-....-..."} 35340288 {pod_name="calico-node-...."} 1101246464 {pod_name="etcd-manager-events-..."} 62708992 ... ``` --- # Query ```ql sum(rate(container_cpu_user_seconds_total{ namespace="cortex",image=~"cortex.+" }[1m])) by (instance) ``` - `sum(<vector expression>) [without|by (label list)]` - ~~group~~ by - https://prometheus.io/docs/prometheus/latest/querying/operators/#aggregation-operators - `rate(container_cpu_user_seconds_total[1m])`: - `rate(v range-vector)` calculates the per-second average rate of increase of the time series in the range vector. - https://prometheus.io/docs/prometheus/latest/querying/functions/#rate - `[1m]`: Range selector for Range vector: - Contain data going back in time`[1m]`. - `container_cpu_system_seconds_total`: - `_seconds_total`: the metric is an accumulator with its unit being seconds. - https://prometheus.io/docs/practices/naming/ --- # Expressions - Instant Vector: set of time series containing single sample for each time series, all sharing same timestamp - `http_request_count{code="200"}` 20 - `http_request_count{code="500"}` 5 - Range Vector: set of time series containing a range of data points over time for each series - `http_request_count{code="200"}[5m]` 13@1568692930.966 20@1568692960.966 25@1568692990.966 32@1568693020.966 - Scalar: a simple numeric floating point value - String: a simple string value; currently unused --- # Instant Vector 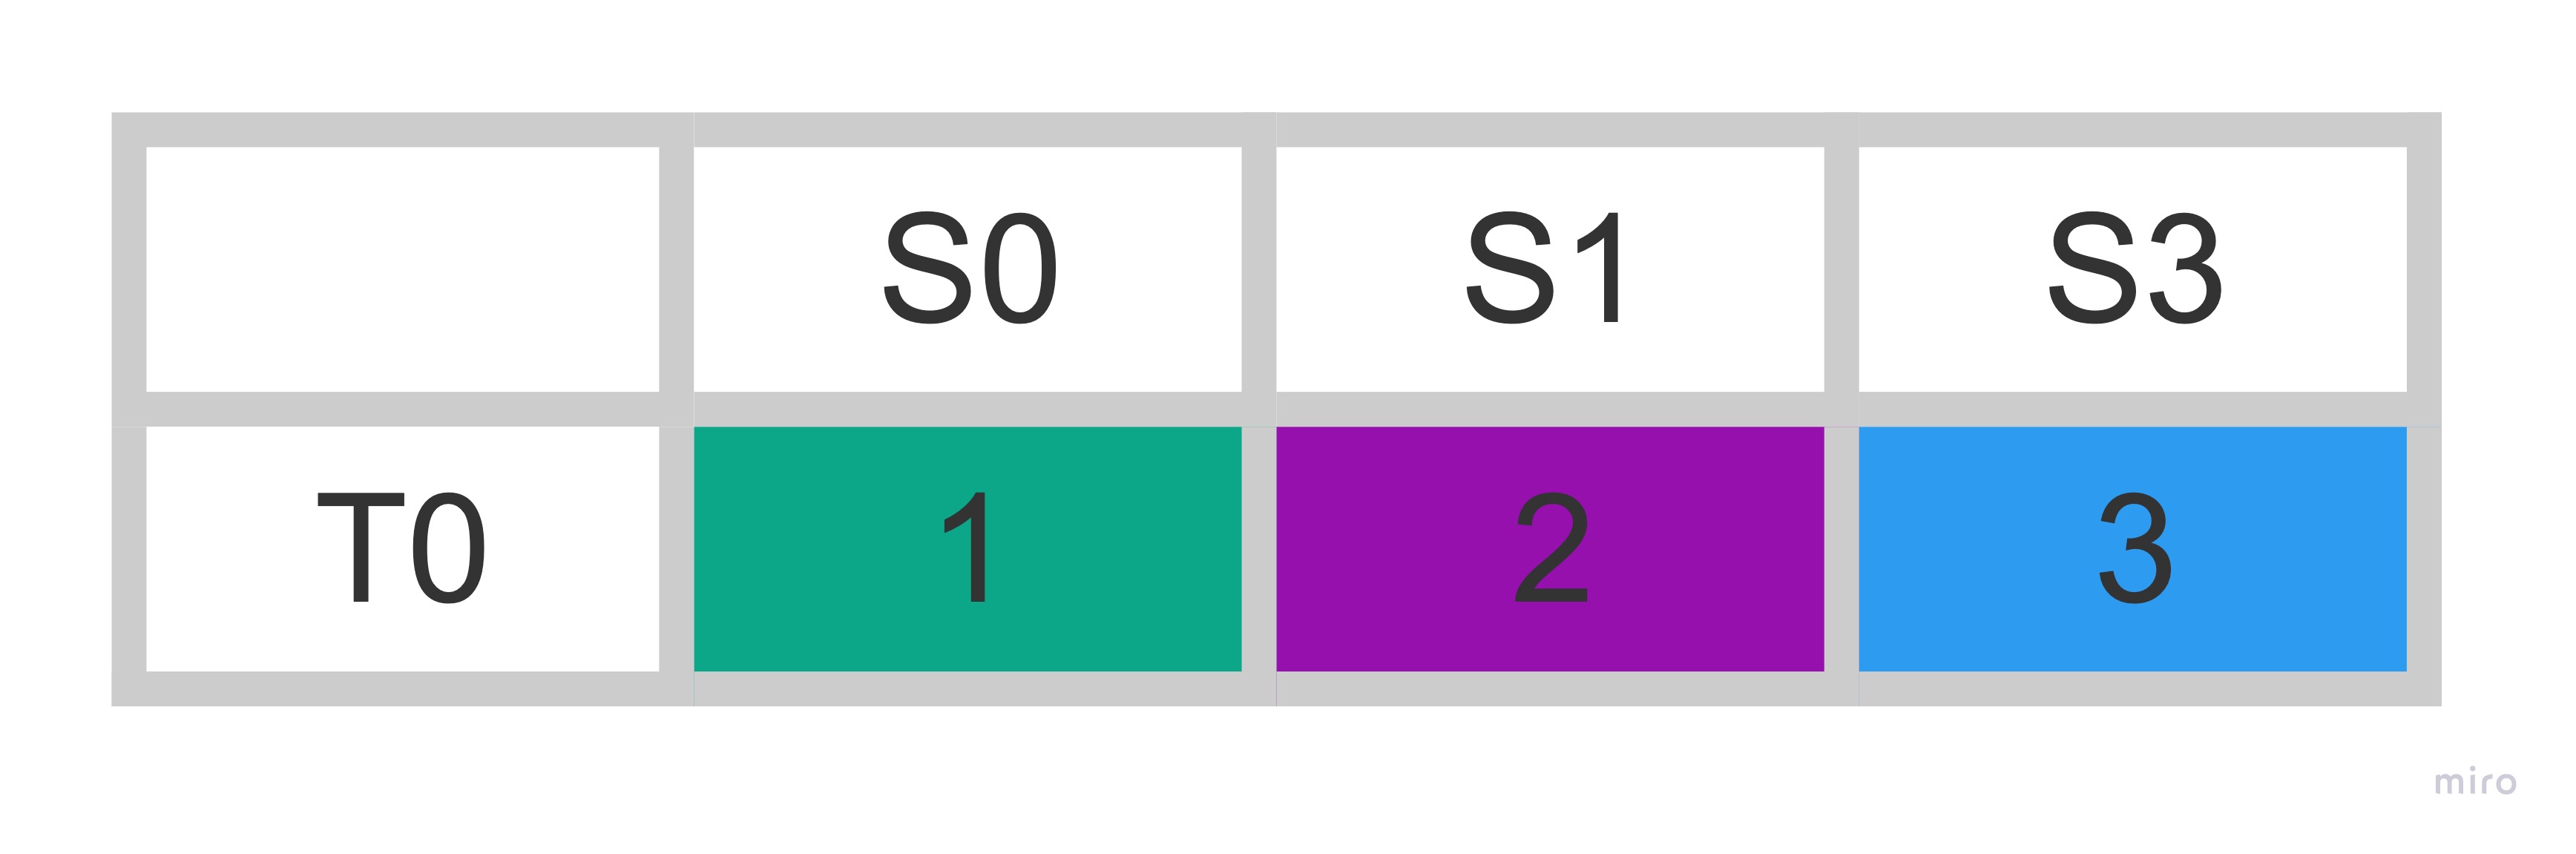 --- class: pic 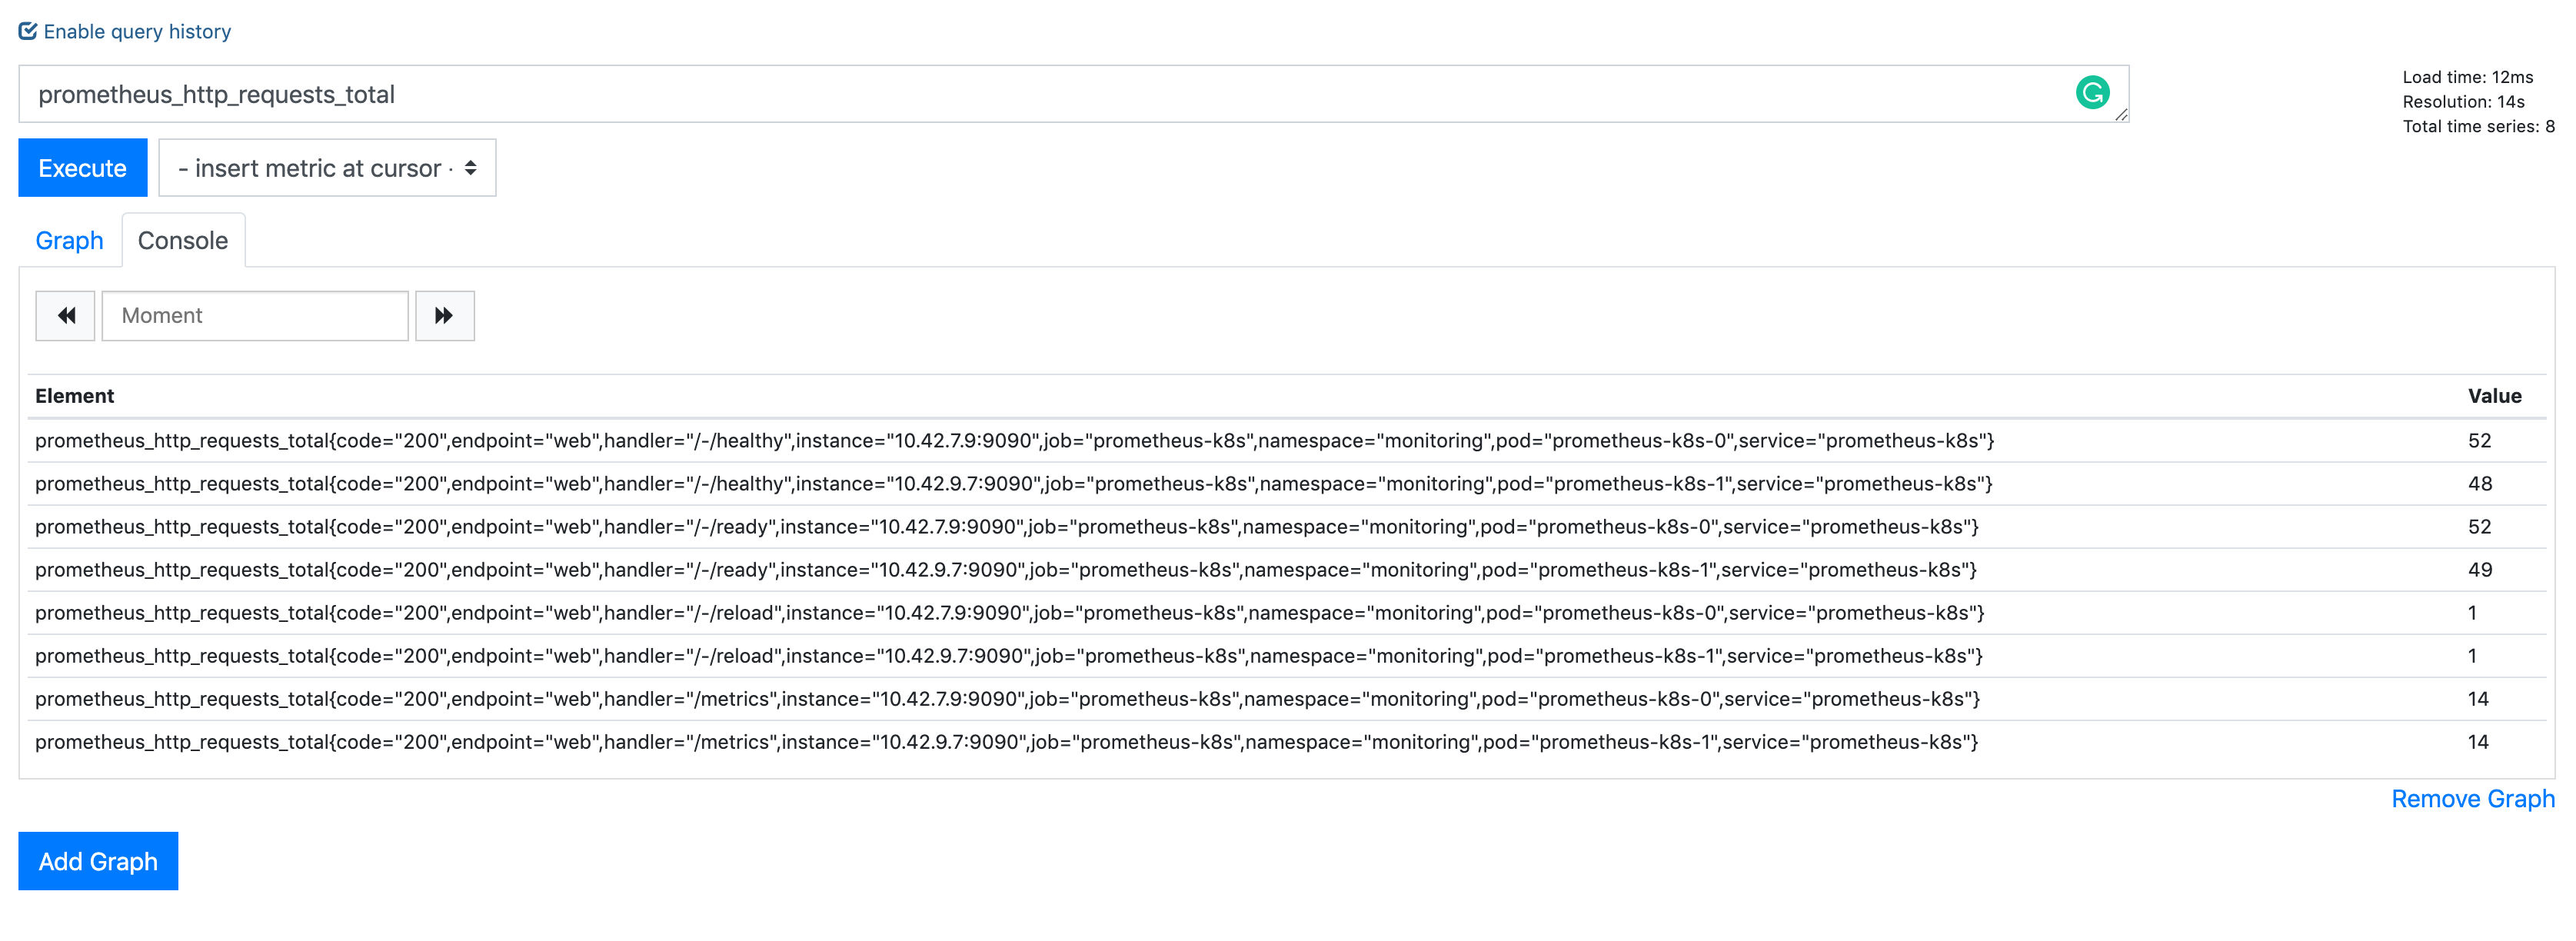 --- # Range Vector 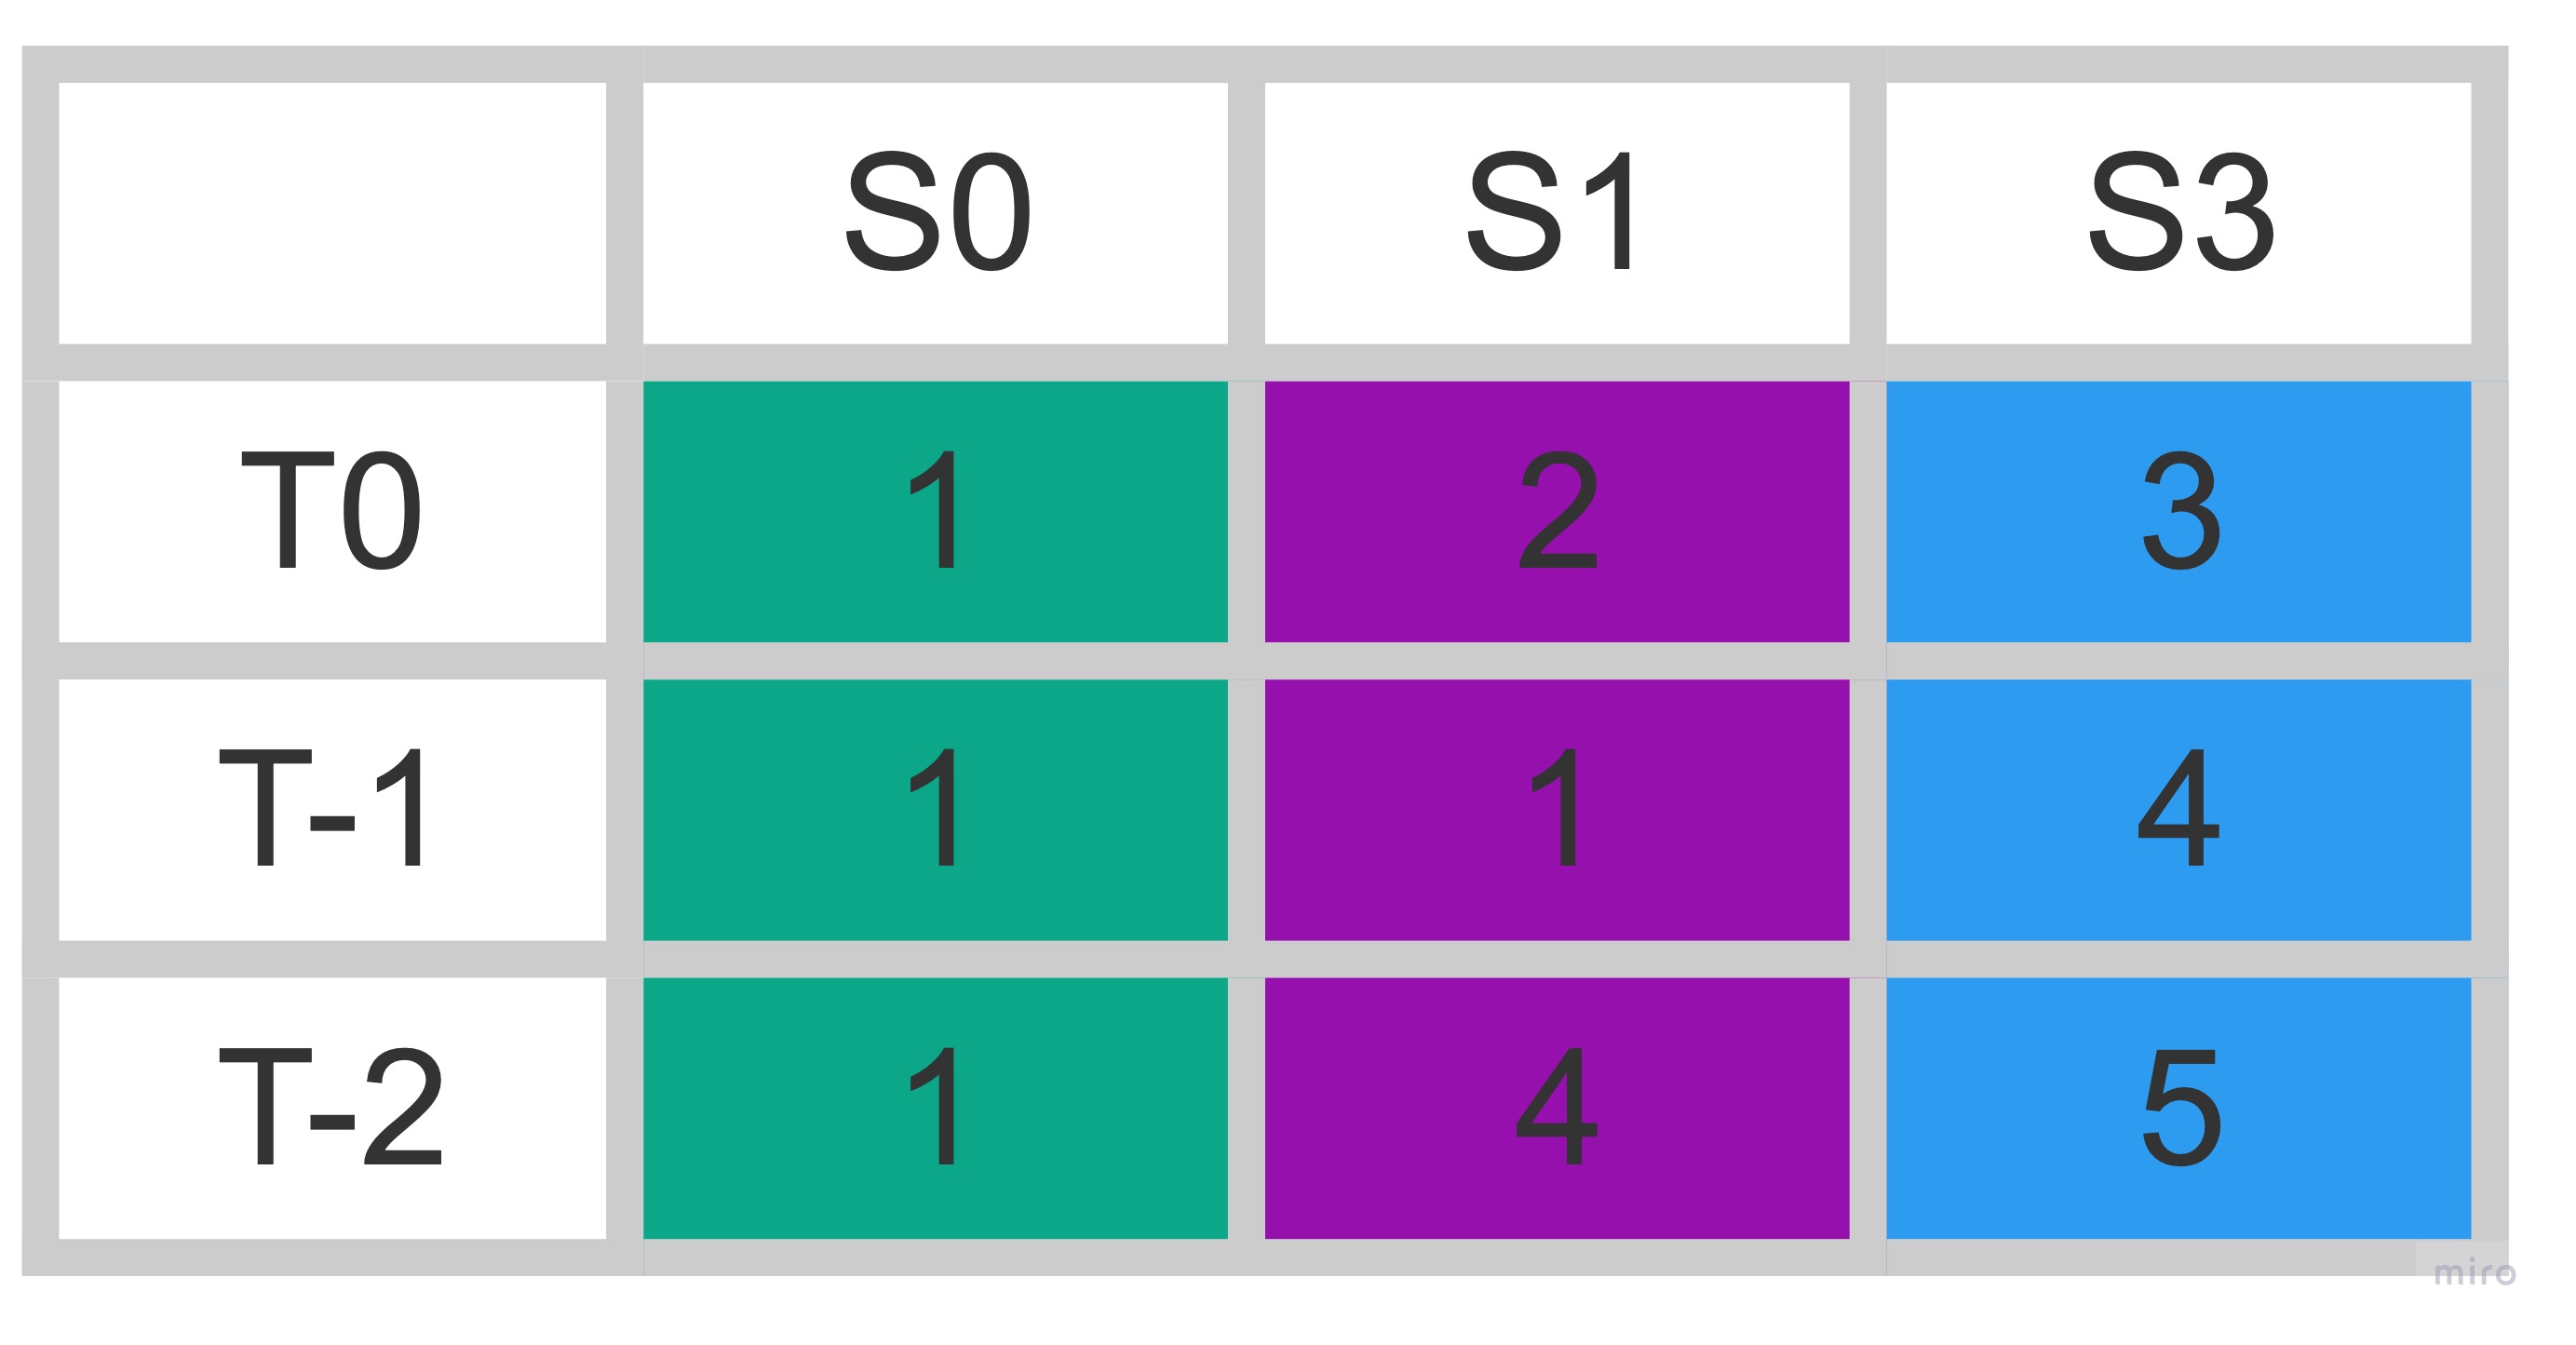 --- class: pic 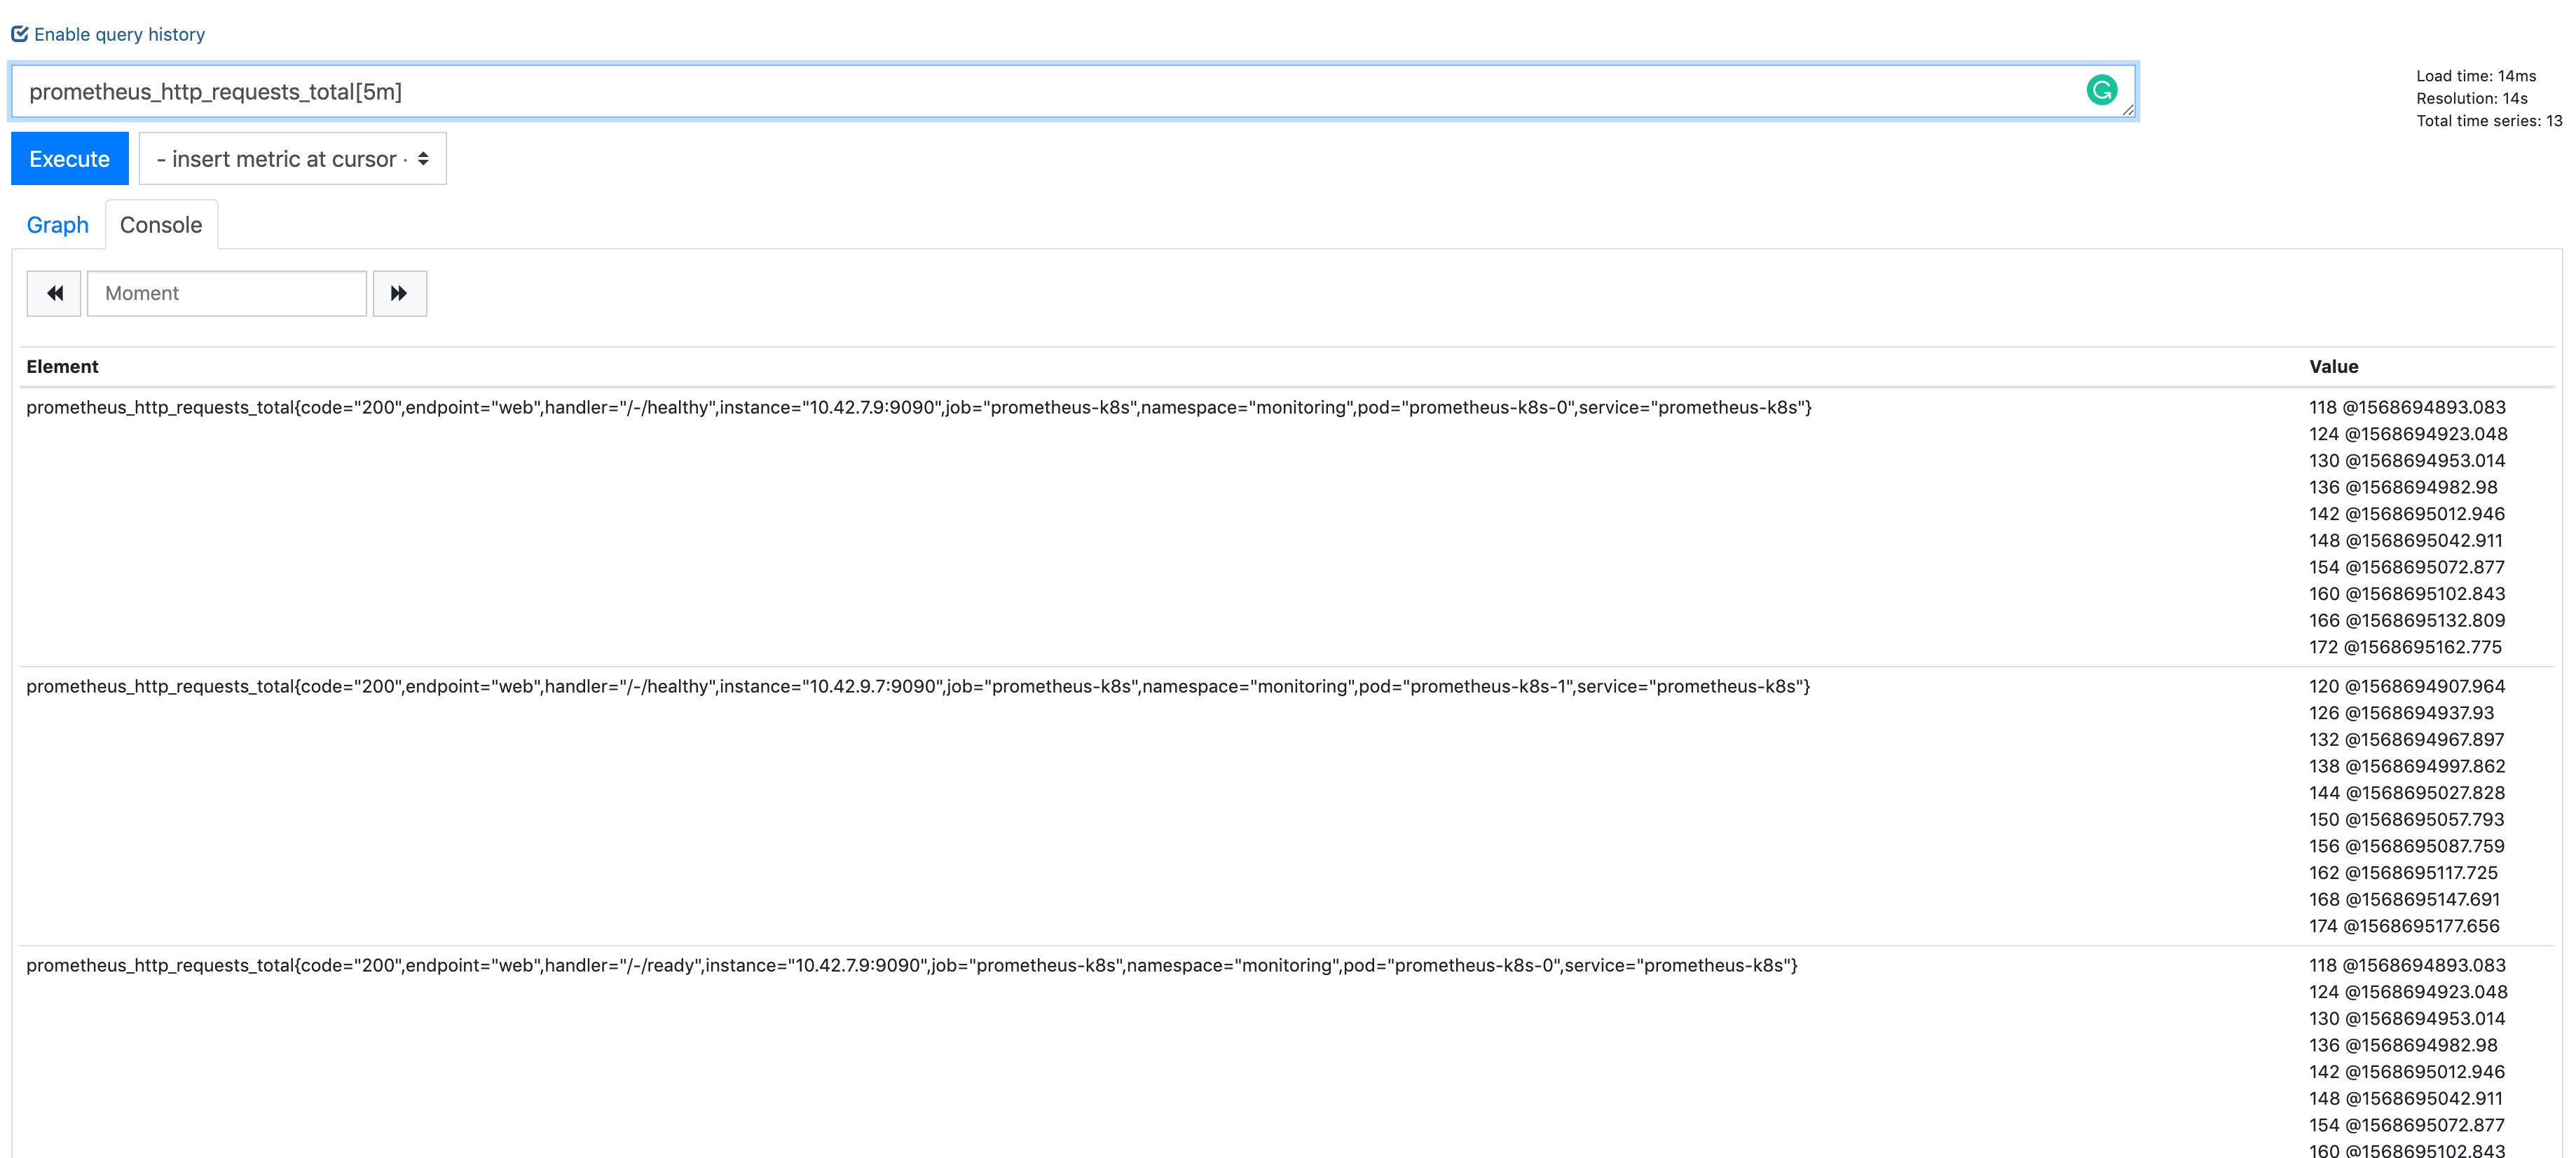 --- class: pic 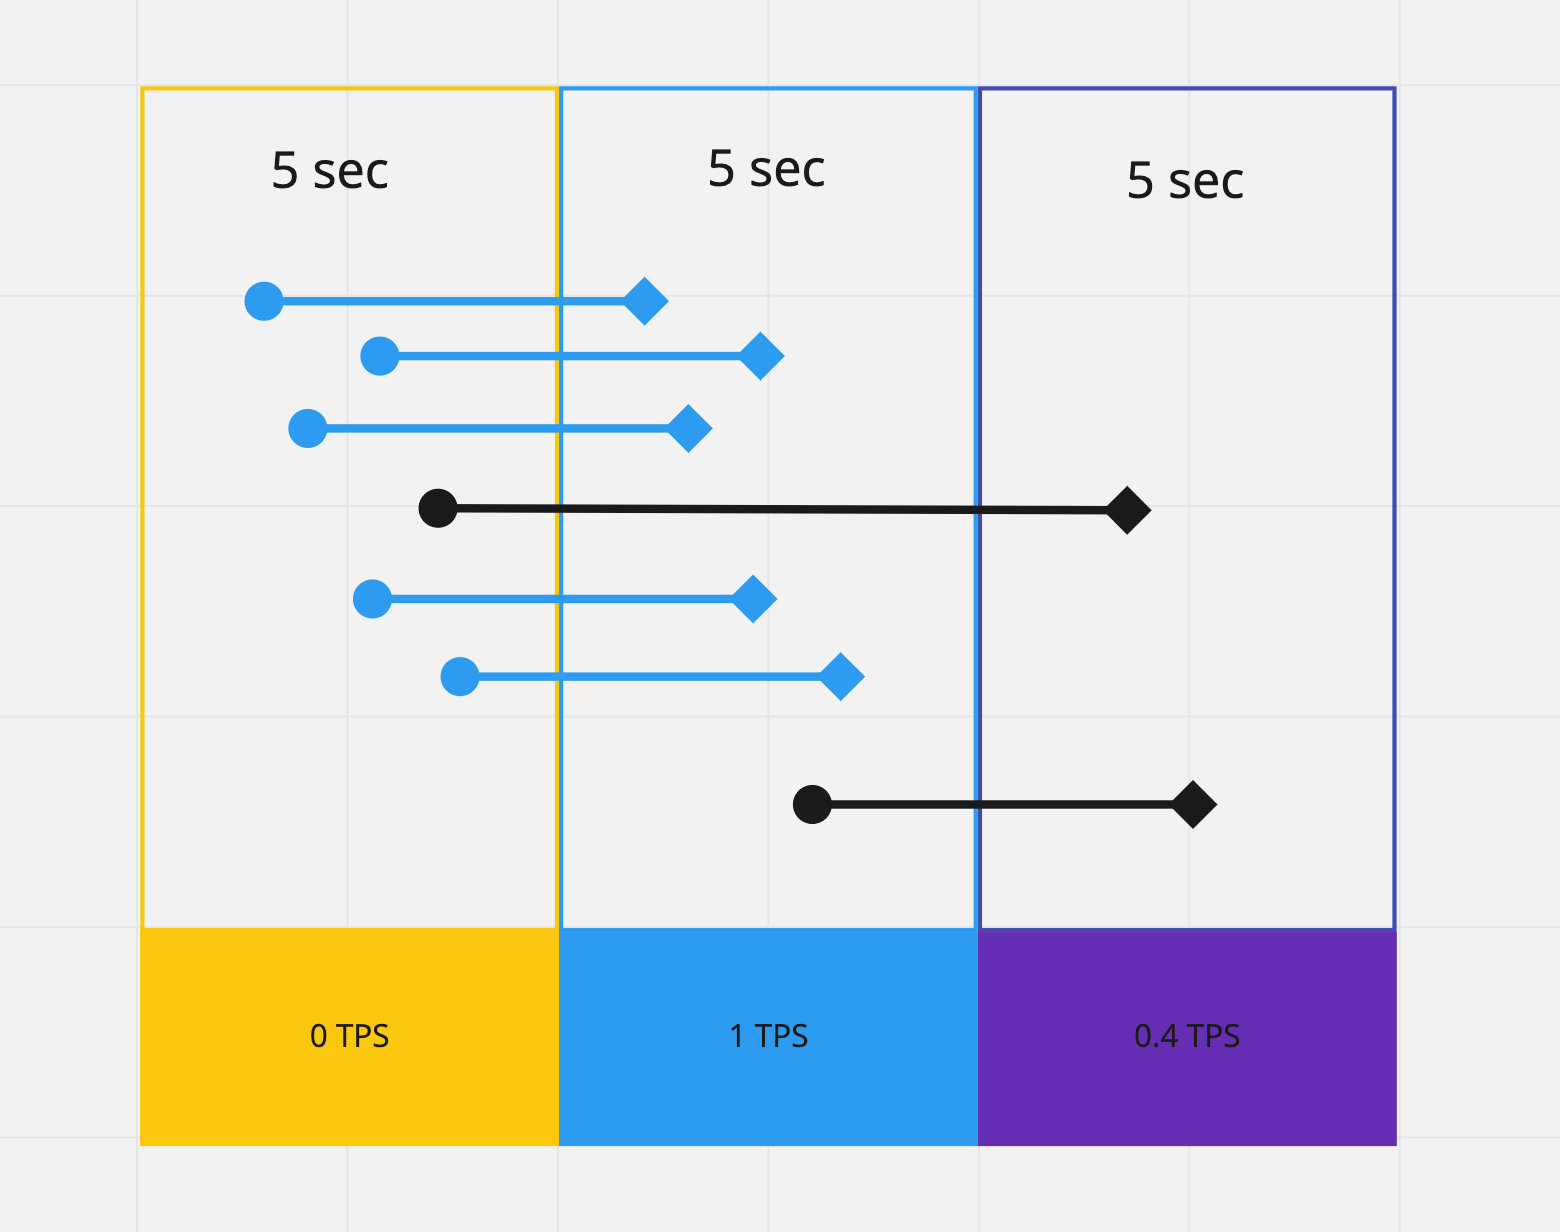 -- <center><pre><code>rate(node_network_receive_bytes_total[5m])</code></pre></center> --- # Operators & Functions - Operators: - Aggregation operators - Binary operators - Vector Matching - Functions: - `rate(v range-vector)` - `increase( v range-vector)` - `avg_over_time(v range-vector)` - `sum_over_time(v range-vector)` - `absent(v instant-vector)` - ... --- # Aggregation operators - Input: `Instant Vector` -> Ouput: `Instant Vector` - `<aggr-op>([parameter,] <vector expression>) [without|by (<label list>)]` - sum - `sum(rate(http_requests_total[5m])) by (job)` - min, max - `max by(instance)(node_filesystem_size_bytes)` - count, count_values - `count_values without(instance)("version", software_version)` - topk, bottomk - `topk(3, sum(rate(instance_cpu_time_ns[5m])) by (app, proc))` - Operators can either be used to aggregate over all label dimensions or preserve distinct dimensions by including a `without` or `by` clause. - `without` clause removes listed labels from resulting vector - `by` clause drops labels not listed from the resulting vector --- # Binary operators - Arithmetic: `+,-,*,/,%,^` - scalar/scalar - vector/scalar - vector/vector - `(instance_memory_limit_bytes - instance_memory_usage_bytes) / 1024 / 1024` - Comparision: `==,!=,>,<,>=,<=` - scalar/scalar, vector/scalar, and vector/vector - Logical/set: - `and`: intersection between vector1 and vector2 - `or`: union of vector1 and vector2 - `unless`: elements of vector1 ofr which no matches in vector2 --- # Vector matching - Operations between vectors attempt to find a matching element in the right-hand side vector for each entry in the left-hand side. - Label Matching - `ignoring` keyword - `<vector expr> <bin-op> ignoring(<label list>) <vector expr>` - `on` keyword - `<vector expr> <bin-op> on(<label list>) <vector expr>` ```ql kube_pod_container_resource_requests_memory_bytes{container="doc"} / on (container) container_memory_usage_bytes{namespace="apimanager"} ``` - __One-to-one__ finds unique pair of entries with all labels matching - __One-to-Many__ / __Many-to-one__ - `group_left`, `group_right` determines cardinality - only used for comparison and arithmetic operations This is really complex, but in the majority of cases this isn’t needed. --- # Vector matching ```ql method_code:http_errors:rate5m{method="get", code="500"} 24 method_code:http_errors:rate5m{method="get", code="404"} 30 method_code:http_errors:rate5m{method="put", code="501"} 3 method_code:http_errors:rate5m{method="post", code="500"} 6 method_code:http_errors:rate5m{method="post", code="404"} 21 method:http_requests:rate5m{method="get"} 600 method:http_requests:rate5m{method="del"} 34 method:http_requests:rate5m{method="post"} 120 ``` ```ql method_code:http_errors:rate5m{code="500"} / ignoring(code) method:http_requests:rate5m ``` ```ql {method="get"} 0.04 // 24 / 600 {method="post"} 0.05 // 6 / 120 ``` --- # Vector matching .pull-left[ 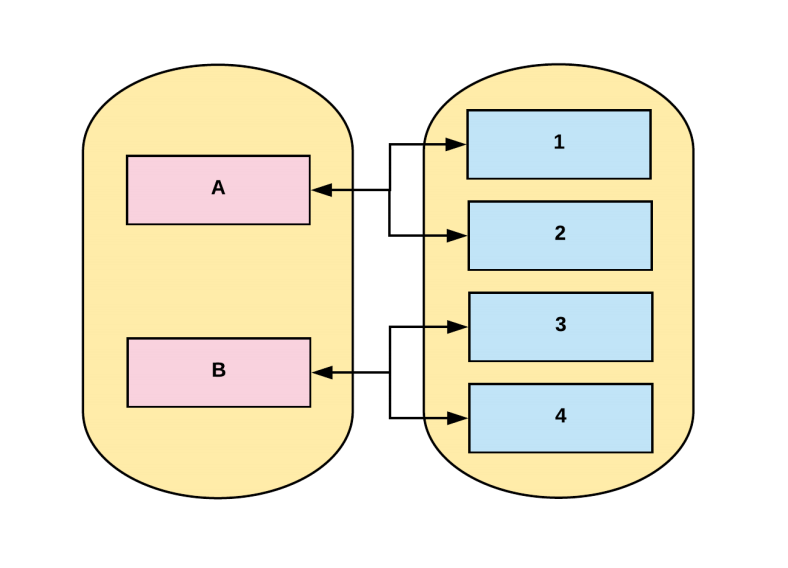 ] .pull-right[ __One-to-many,Many-to-one__ Element on one side matches with many on the other __group_right__ when right side has higher cardinality ] Many-to-one and one-to-many matching are advanced use cases that should be carefully considered. --- # Vector matching ```ql method_code:http_errors:rate5m / ignoring(code) group_left method:http_requests:rate5m ``` ```ql {method="get", code="500"} 0.04 // 24 / 600 {method="get", code="404"} 0.05 // 30 / 600 {method="post", code="500"} 0.05 // 6 / 120 {method="post", code="404"} 0.175 // 21 / 120 ``` ```ql method_code:http_errors:rate5m{method="get", code="500"} 24 method_code:http_errors:rate5m{method="get", code="404"} 30 method_code:http_errors:rate5m{method="put", code="501"} 3 method_code:http_errors:rate5m{method="post", code="500"} 6 method_code:http_errors:rate5m{method="post", code="404"} 21 method:http_requests:rate5m{method="get"} 600 method:http_requests:rate5m{method="del"} 34 method:http_requests:rate5m{method="post"} 120 ``` --- # Vector matching ```ql max by (namespace, pod, node, pod_ip) (kube_pod_info) * on (namespace, pod) group_left (phase) (kube_pod_status_phase{namespace="default"} == 1) ``` ```ql {namespace="...",pod="...",node="...",pod_ip="1.2.3.4",phase="..."} 1 ``` - https://github.com/kubernetes/kube-state-metrics/blob/master/docs/pod-metrics.md --- # Recording rules ```ql groups: - name: example rules: - record: pod:info expr: | max by (namespace, pod, node, pod_ip) (kube_pod_info) * on (namespace, pod) group_left (phase) (kube_pod_status_phase{namespace="default"} == 1) - record: pod:pending expr: pod:info{phase="Pending"} - record: job:http_inprogress_requests:sum expr: sum(http_inprogress_requests) by (job) ``` Recording rules allow you to precompute frequently needed or computationally expensive expressions and save their result as a new set of time series. https://prometheus.io/docs/prometheus/latest/configuration/recording_rules/#recording-rules Recording rules should be of the general form `level:metric:operations`. --- # Functions __label_join()__ `label_join(v instant-vector, dst_label string, separator string, src_label_1 string, src_label_2 string, ...)` `label_join(up{job="api-server",src1="a",src2="b",src3="c"}, "foo", ",", "src1", "src2", "src3")` __label_replace()__ `label_replace(v instant-vector, dst_label string, replacement string, src_label string, regex string` `label_replace(up{job="api-server",service="a:c"}, "foo", "$1", "service", "(.*):.*")` __increase(v range-vector)__ `increase(http_requests_total[1h])` --- # Metric types - Counter - Gauge - Histogram - Summary --- # Gauge A gauge is a metric that represents a single numerical value that can arbitrarily go up and down. - heap memory used - cpu usage - items in queue ```ql sum without(instance) (my_gauge) avg without(instance) (my_gauge) min without(instance) (my_gauge) max without(instance) (my_gauge) ``` --- # Counter A counter is a metric that starts at 0 and is incremented. - `rate()` , `increase()`: This functions return gauges from counters - `_total` suffix is describing counter metric type ```ql sum without(instance) (rate(my_counter_total[5m])) ``` --- # Histogram Samples observations(e.g. request durations or response sizes) and counts them in configurable buckets - Bucket: Buckets are counter of observations. - `<basename>_bucket {le = “<bound_value>”}` - Sum of the observation: the total sum of all observed values - `<basename>_sum` - Count of the observation: count of events that have been observed - `<basename>_count` ```ql histogram_quantile(0.9, sum without (instance)(rate(my_histogram_latency_seconds_bucket[5m]))) ``` ```ql request_latency_seconds_bucket{le="0.075"} 10.0 request_latency_seconds_bucket{le="1.0"} 10.0 request_latency_seconds_bucket{le="+Inf"} 11.0 request_latency_seconds_count 11.0 request_latency_seconds_sum 3.3 ``` --- # Summary Similar to a histogram, a summary samples observations (usually things like request durations and response sizes). average latency: ```ql sum without (instance)(rate(my_summary_latency_seconds_sum[5m])) / sum without (instance)(rate(my_summary_latency_seconds_count[5m])) ``` ```ql go_gc_duration_seconds{quantile="0"} 0.000236554 go_gc_duration_seconds{quantile="0.25"} 0.000474629 go_gc_duration_seconds{quantile="0.5"} 0.0005691670000000001 go_gc_duration_seconds{quantile="0.75"} 0.000677597 go_gc_duration_seconds{quantile="1"} 0.002479919 go_gc_duration_seconds_sum 12.532527861 go_gc_duration_seconds_count 24279 ``` --- # Metric methods - Four Golden Signals - USE - RED --- # Four Golden Signals https://landing.google.com/sre/sre-book/chapters/monitoring-distributed-systems/ - __Latency__: The time it takes to service a request. - __Errors__: The rate of requests that fail, either explicitly, implicitly, or by policy - __Traffic__: A measure of how much demand is being placed on your system - __Saturation__: How "full" your service is. --- # USE method http://www.brendangregg.com/usemethod.html - __Resource__: all physical server functional components (CPUs, disks, busses, …) - __Utilization__: the average time that the resource was busy servicing work - __Saturation__: the degree to which the resource has extra work which it can’t service, often queued - __Errors__: the count of error events `USE Method: Linux Performance Checklist:` http://www.brendangregg.com/USEmethod/use-linux.html --- # RED method - __Rate__: The number of __requests__ per second. - __Errors__: The number of those __requests__ that are failing. - __Duration__: The amount of time those __requests__ take. "The USE method is for resources and the RED method is for my services” — Tom Wilkie --- class: pic 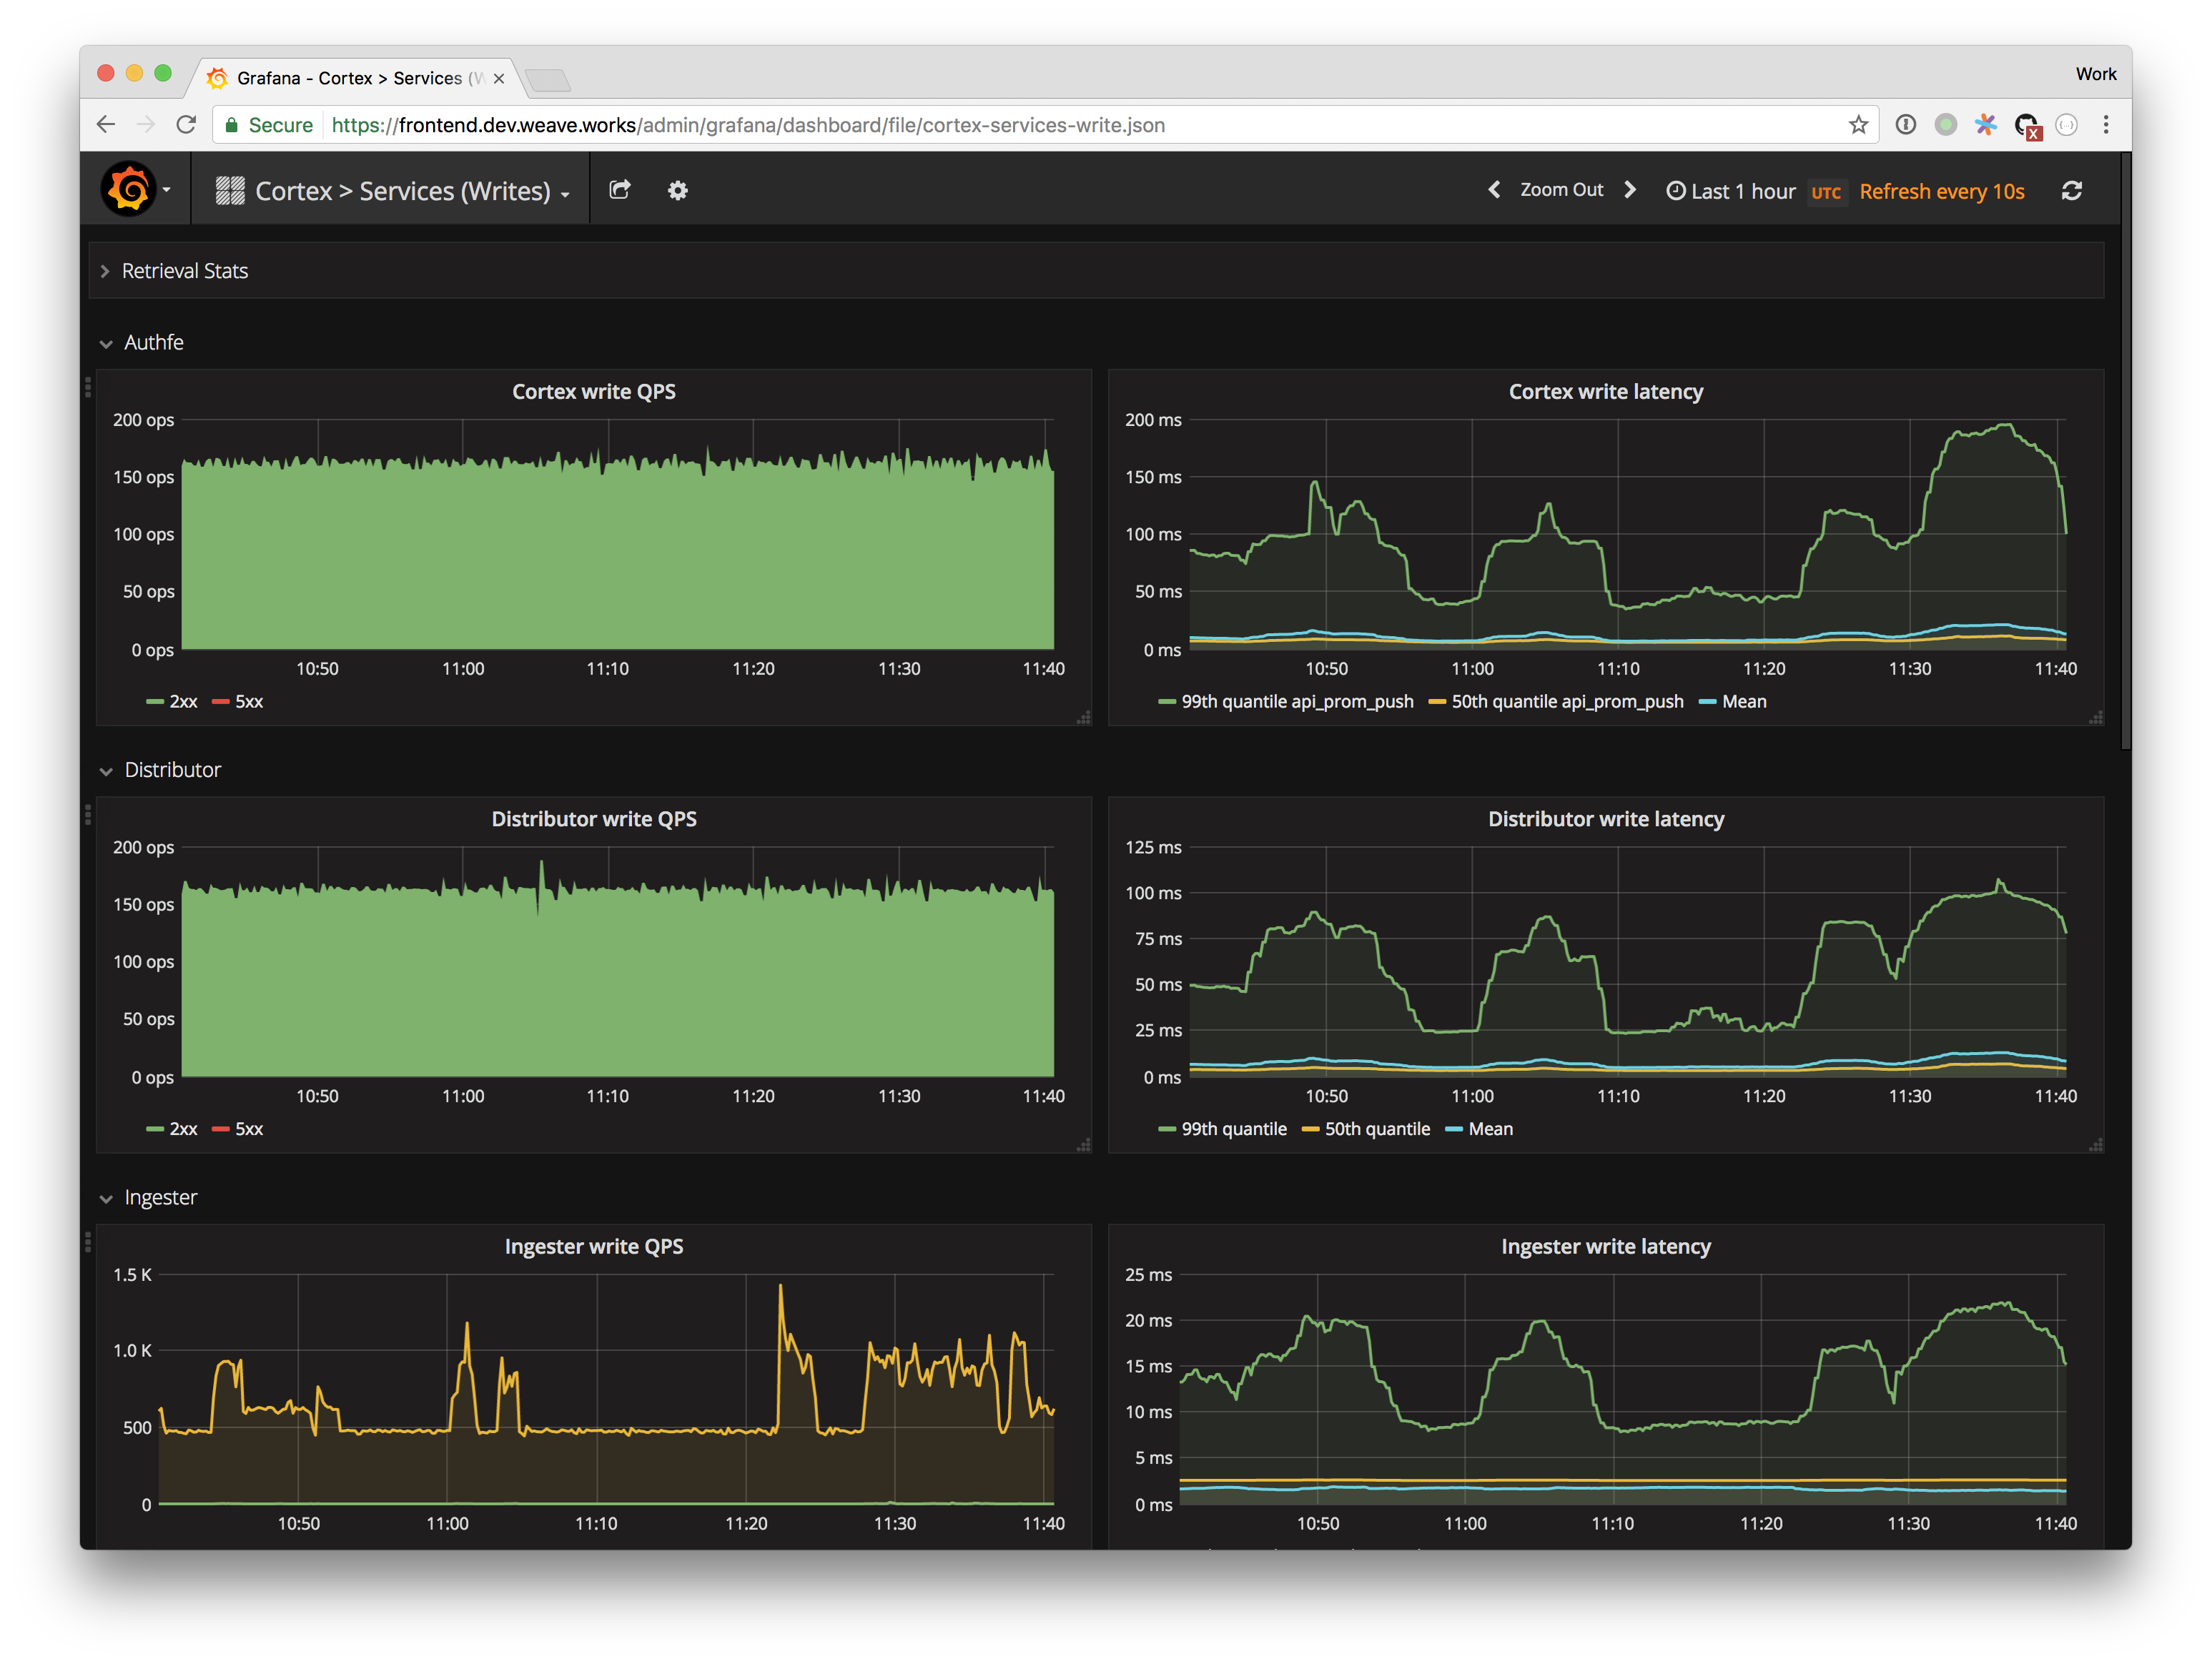 https://www.weave.works/blog/the-red-method-key-metrics-for-microservices-architecture/ --- # RED Method from: https://www.weave.works/blog/the-red-method-key-metrics-for-microservices-architecture/ > Another nice aspect of the REDMethod is that it helps you think how to build your dashboards. > You should bring these three metrics front-and-center for each service and error rate should be expressed as a propotion of request rate. > At Weaveworks,we settled on __a pretty standard format for our dashboards__ > - __two columnes, one row per service, request & error rate on the left, latency on the right__ --- class: pic  --- # Node Metrics and the USE Method 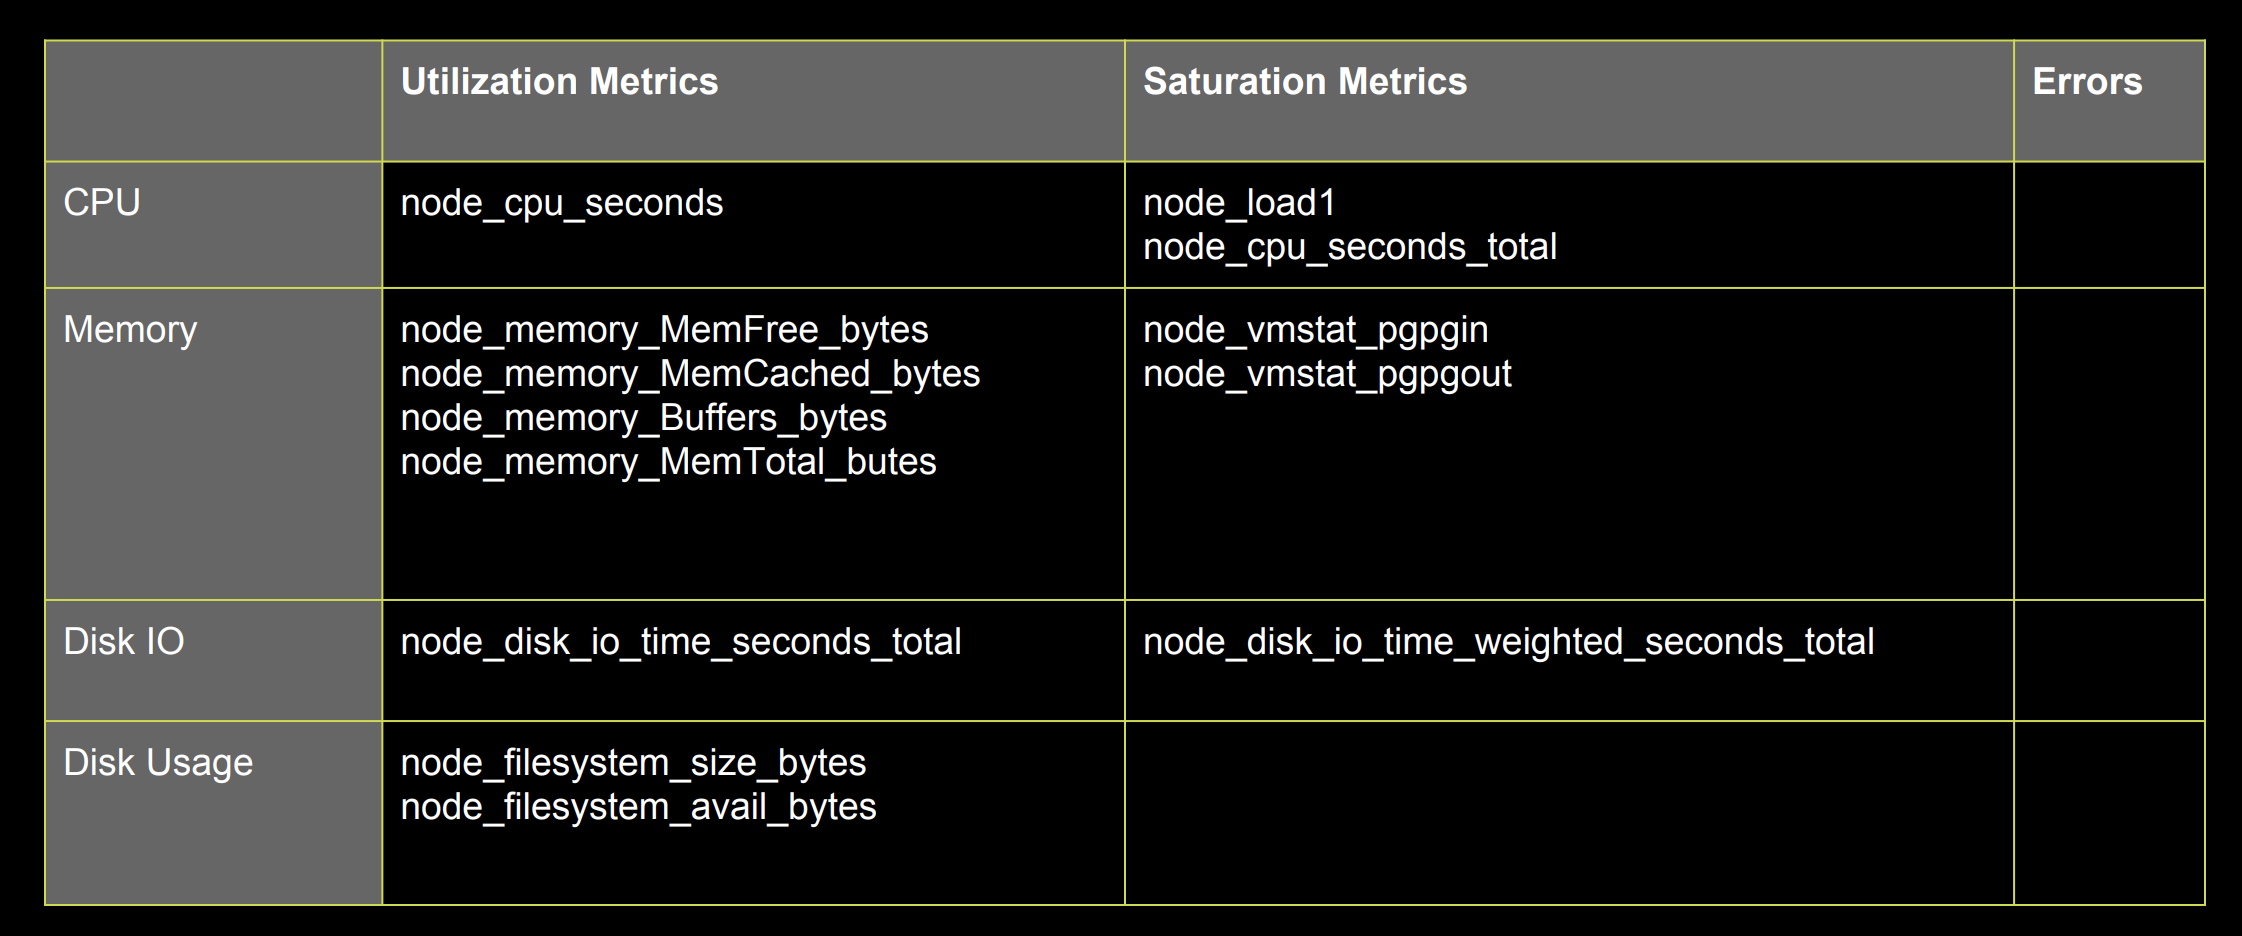 ```ql sum(rate(node_cpu_seconds_total{mode!="idle",mode!="iowait" }[5m])) BY (instance) ``` ```ql count(node_cpu{mode="system"}) by (node) ``` ```ql sum(node_load1) by (node) / count(node_cpu{mode="system"}) by (node) * 100 ``` --- # Container Metrics from cAdvisor Containers are a Resource - `USE` 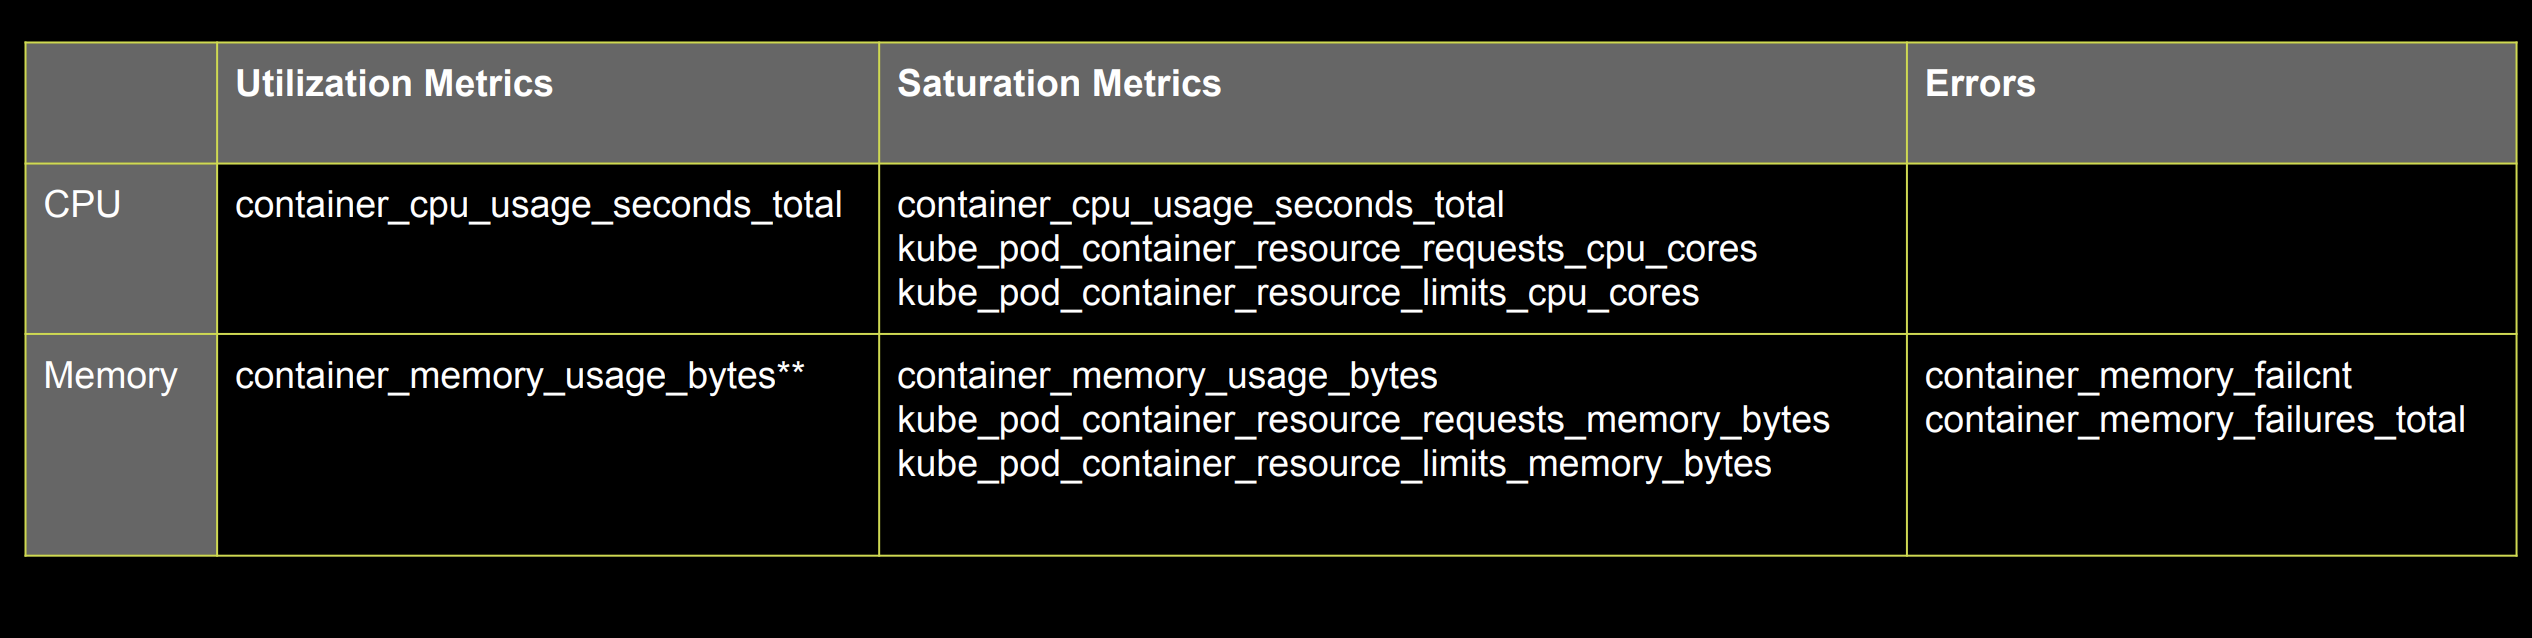 ```ql sum(rate(container_cpu_usage_seconds_total[5m])) by (contaner_name) sum(container_memory_working_set_bytes{name!~"POD"}) by (name) ``` ```ql sum(rate(container_network_receive_bytes_total[5m])) by (name) sum(rate(container_network_transmit_bytes_total[5m])) by (name) ``` --- # The K8s API Server is a Service - RED 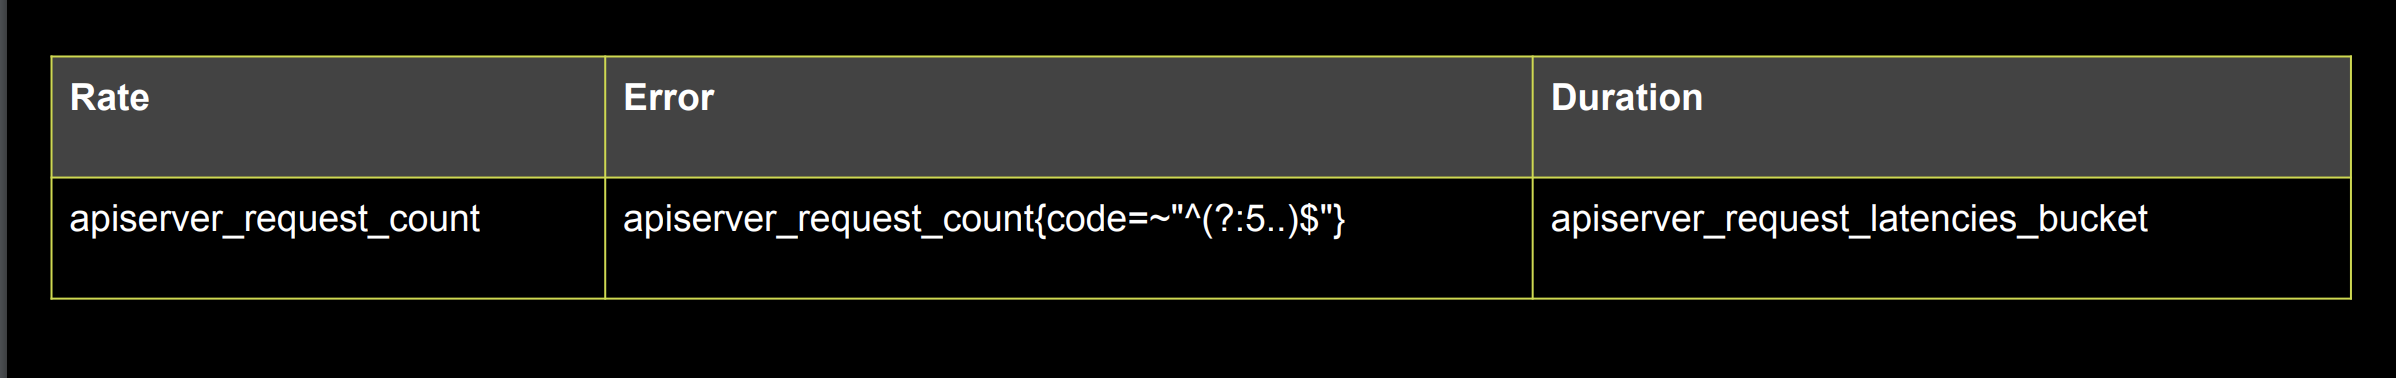 ```ql sum(rate(apiserver_request_count[5m])) by (resource, subresource, verb) ``` ```ql histogram_quantile(0.9, sum(rate(apiserver_request_latencies_bucket[5m])) by (le, resource, subresource, verb) ) / 1e+06 ``` --- # kube-state-metrics https://github.com/kubernetes/kube-state-metrics kube-state-metrics is a simple service that listens to the Kubernetes API server and generates metrics about __the state of the objects__. https://github.com/kubernetes/kube-state-metrics/tree/master/docs ```ql count(kube_pod_status_phase{phase="Running"}) count(kube_pod_status_phase{phase="Failed"}) ``` ```ql kube_pod_labels{ label_name="frontdoor", label_version="1.0.1", label_role="blue", label_service="aservice", namespace="default", pod="frontdoor-xxxxxxxxx-xxxxxx", } = 1 ``` --- # kube_pod_labels ```json http_requests_total{code="200",endpoint="http-metrics",handler="prometheus",instance="1.1.1.1:10252",job="kube-controller-manager",method="get",namespace="kube-system",pod="kube-controller-manager.internal",service="kube-controller-manager"} ``` ```ql sum( rate(http_request_count{code=~"^(?:5..)$"}[5m])) by (pod) * on (pod) group_left(label_version) kube_pod_labels ``` ~~CRD~~ : https://github.com/kubernetes/kube-state-metrics/issues/303